Diagnosing a Sitecore Memory Leak when using a Custom Controller Factory
Post Contents
The Problem
An application is using excessive amounts of memory causing slow response times and application pool recycles.
Reproducing the issue
Generate some load for your application locally, I used JMeter , Martina Welander has an excellent post on setting it up – https://mhwelander.net/2014/07/25/generating-sample-sitecore-analytics-data-with-jmeter to generate some sample traffic. This scenario does not require you to worry about cookies you just need some same load to reproduce the memory leak.
Diagnosing with dotMemory
Launch dotMemory from JetBrains when your load from JMeter has finished you can attach to the w3wp.exe process from Local Sessions and Run the Profiler with the Control profiling manually radio selected.
Once the Profiler is attached hit Get Snapshot
When the snapshot has finished processing you will end up with something like this
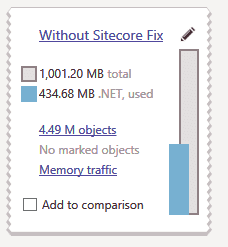
Click the snapshot and you will be taken to a screen showing lots of automatic memory profiling sections and figures.
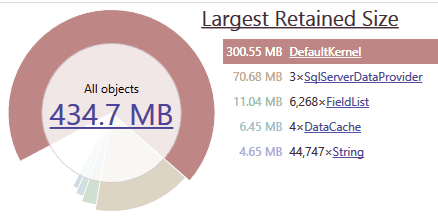
The breakdown of the Largest Retained Size objects has the Castle Windsor DefaultKernal namespace at the top of the list using 300MB of memory, clicking this give you the full breakdown of memory usage.
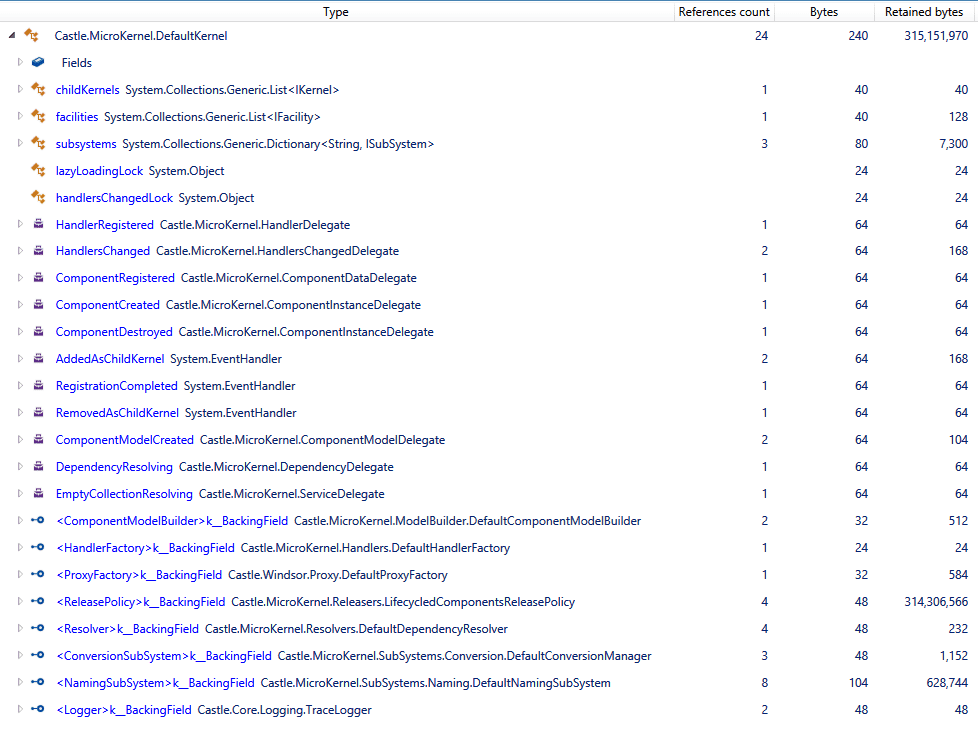
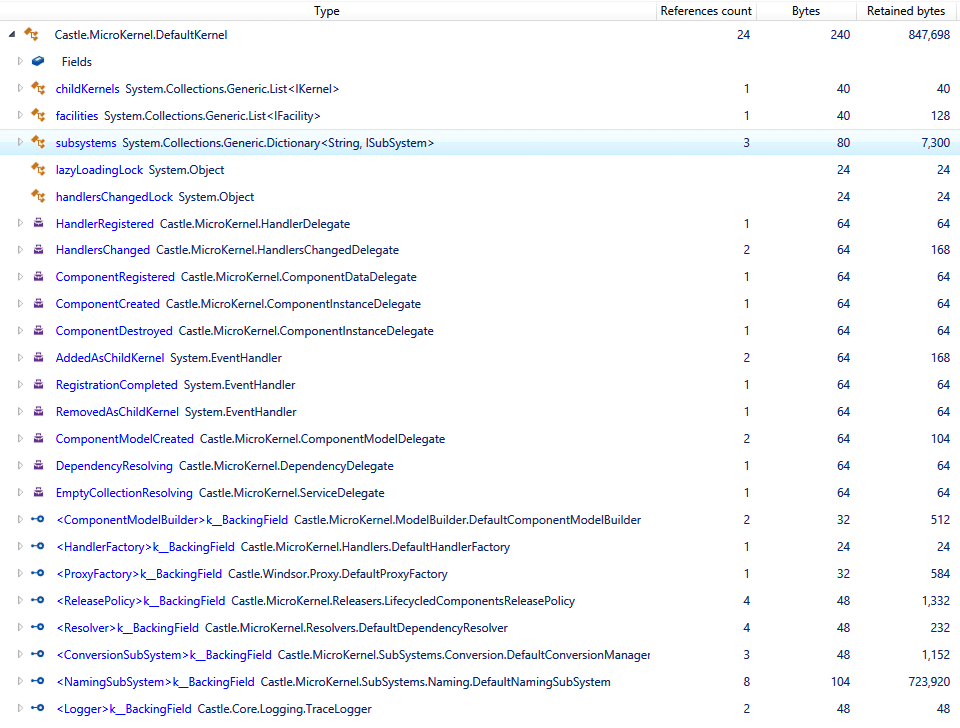
The LifecycledComponentsReleasePolicy class is using most of the memory and in particular the instance2Burden dictionary has 17,519 entries taking up 314MB.

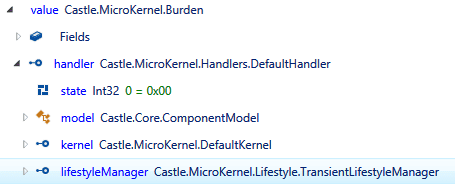
Inspecting these entries they were lots of Controllers registered to the Castle Windsor container, with a Lifecycle of Transient but the are not being released by the custom controller factory.
The Fix
I found an article that describes this issue on the Sitecore Knowledge Base – https://kb.sitecore.net/articles/535948
When using a custom MVC controller factory on the Sitecore solution in a specific manner, the web site may experience excessive memory usage.
The issue is caused by specifics of Sitecore implementation of using custom MVC controllers.
You can read more of the technical details of the fix on the knowledge base site but there is a config file and dll to add to your solution to resolve the issue. The issue applies to Sitecore versions 7.5 Initial Release – 8.0 Update-6, 8.1 Initial Release+ if you are on Sitecore 8.0 Update-7 the issue is fixed.
Note :- The dll has been complied with System.Web.Mvc 5.2.3 referenced, if your project is not using that version you can use a binding redirect to match your solutions version.
Testing the Fix
Run the same load from JMeter through the site after adding the new config file and dll to your solution.
Note :- If you attach dotMemory to the w3wp.exe process when you are running the load test it slows things down significantly so you can wait to attach to the process until after the load has finished.
Once the Profiler is attached hit Get Snapshot
When the snapshot has finished processing you will be able to compere the memory used side by side with your original snapshot.

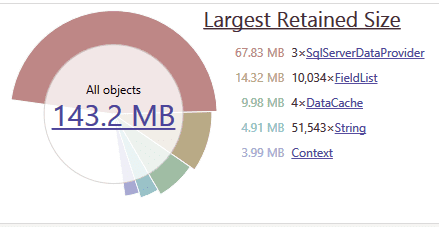
You can see around 300MB less memory is being used after adding the Sitecore fix.
Drilling down in to the detail with dotMemory you can confirm CastleWindsor is now releasing the Transient life-cycled controller references.
